Visual Exploration of Ontologies with TopBraid EDG
Users often want to explore knowledge models visually. Diagrams help them in understanding the models and are especially useful when discussing models with colleagues. To support these needs, TopBraid EDG added a new EDG Diagram panel in the 7.2 release. It supports visual exploration of the ontology models and data alike. In this article we will focus on how ontologies are displayed.
Overview of the Ontology Diagram
UML class diagrams and ER (entity-relationship) diagrams first appeared more than 40 years ago and quickly became the most commonly used visualizations of data models. Similar types of diagrams can be used for ontology classes and properties. A simple diagram in TopBraid EDG looks as follows:
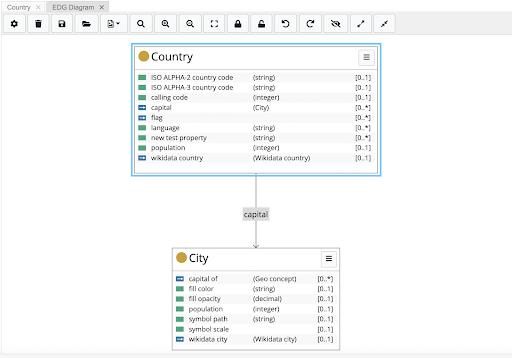
The diagram shows two box shapes for two classes – Country and City. Each box lists properties defined for the members of a class, the range of property values and the number of values. For example, Country has calling code property. Its values are integers and a country can have, at most, one calling code.
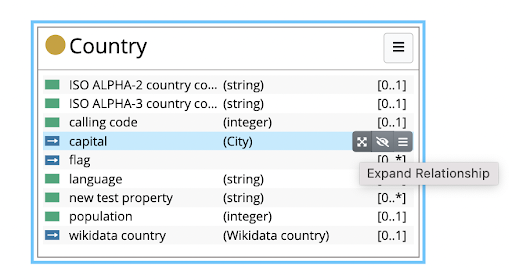
Properties with literal values are shown with green icons. Properties that are relationships to other countries are shown with blue icons and can be expanded to display relationships as arrows pointing to the related classes. For example, in the diagram above capital relationship was expanded. Expansion can be done for specific relationships by hovering over it and selecting the Expand Relationship menu option.
It is also possible to expand all relationships with a single click. Menu at the upper right of the diagram shows several expansion options including ability to expand all relationships (associations) and even expand relationships of all related classes.
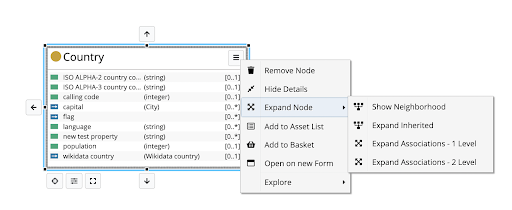
Arrow icons on each side of a rectangle, also support expansions if a user want to control where the expanded boxes will be placed.
Display of Classes and Subclasses
Classes in ontology models have special relationships with their “parent” classes. In EDG, the subclass hierarchy is displayed when a user selects Expand Inherited.
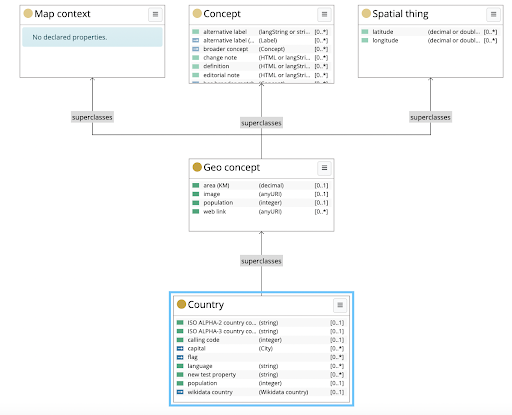
We see, for example, that Country is a subclass of Geo concept which has additional properties such as area(KM) and population.
Sharing Diagrams
Once you have displayed a portion of an ontology that you may want to share with a colleague, TopBraid EDG supports naming and saving of diagrams. The saved diagram preserves the scope of the displayed model and the exact layout of the information.
Users can share links to diagrams. Since diagrams are treated as the “first class citizens”, future functionality will support attaching comments, notes and discussions directly to the diagrams. This will further facilitate reviews of models and establishment of the shared understanding of their meaning.
Visualizing Larger Ontologies
Some tools will attempt creating a diagram for an entire ontology. In practice, this works only for the relatively small models. Such an approach also does not support focusing the attention on a specific part of the model that needs input or discussion.
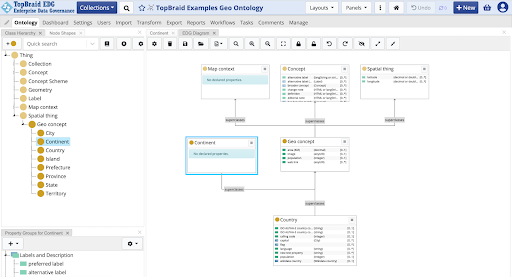
With TopBraid EDG Diagram, users have to select classes (and/or node shapes) they want to visualize. To make it easy to create visualization of several classes, the diagram supports drag and drop. Users can quickly drop classes of interest into the canvas from other panels (such as the class tree). Once a new class is dropped into the canvas, EDG will automatically display its connection to classes that are already present in the canvas.
For example, we have dropped the class Continent into the canvas showing the diagram in the previous screenshot. Its connection to the class Geo Concept was immediately shown.
The diagram canvas is scrollable and its content is resizable to accommodate creation of larger diagrams. Search within the diagram is also supported. Other features for managing space and display include ability to collapse the boxes, configure what is shown in them and configuration of color, weight and shape of the arrows.
Visualizing Ontologies and Data
This article focused on visualization of the ontology models e.g., classes and properties. Sometimes, it is important to combine in the display classes and instances. This can be useful when there is a finite, controlled set of instances. For example, we may want to add all continents to the diagram above. It is also useful when one wants to illustrate the models with the example of data that is based on the model. TopBraid EDG diagrams can display not only models, but also data. In the next article we will talk about using diagrams to visualize data.


